Tableau Projects
This is a project I did to brush up on my Tableau skills. There are two parts to this project. The first part is about learning how to use joins in Tableau. The second part is implementing joins and making a dashboard.
Utilizing joins
Joins in Tableau are similar to joins in SQL. You need to be able to identify primary and foreign keys between the tables you are working with. Take a look at the dataset I worked with below.
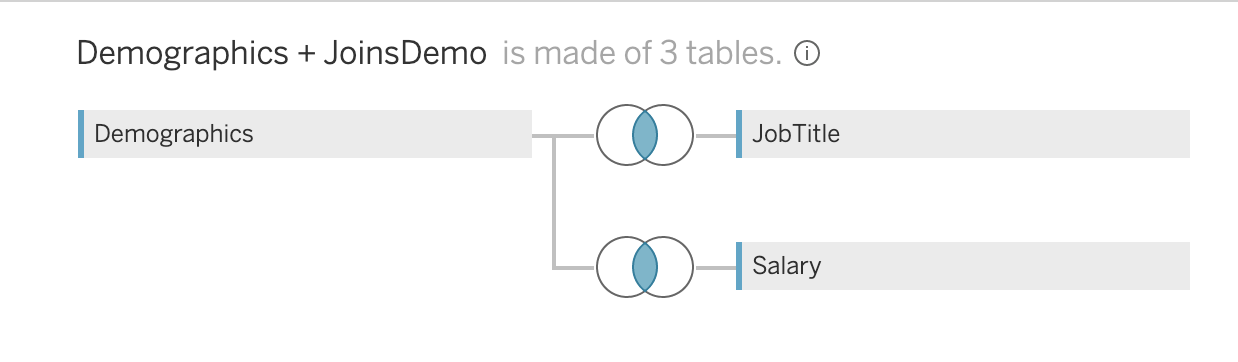
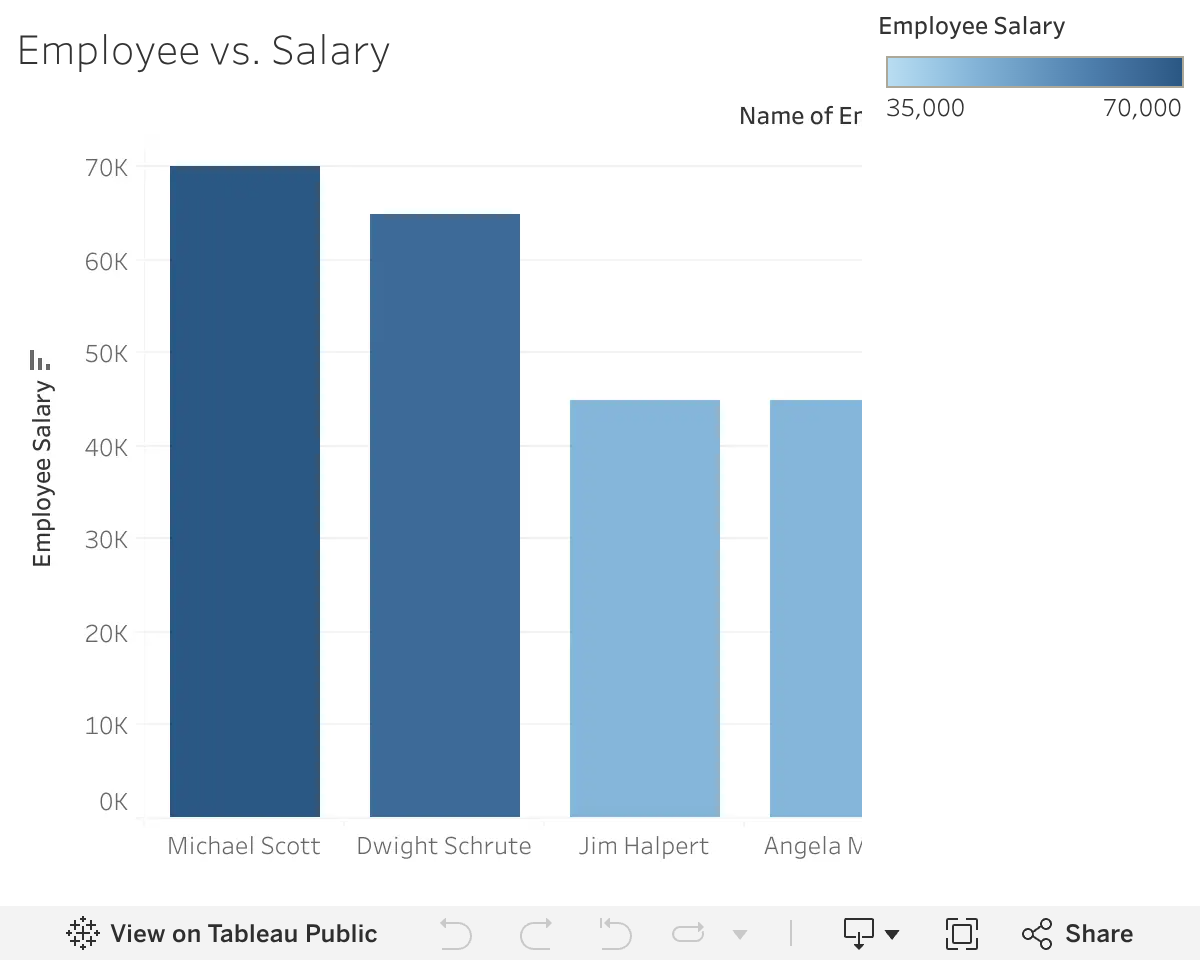
For this dataset, I utilized an Inner Join to connect all the tables together. You can take a look at the data-viz I made using this dataset.
Airbnb dashboard
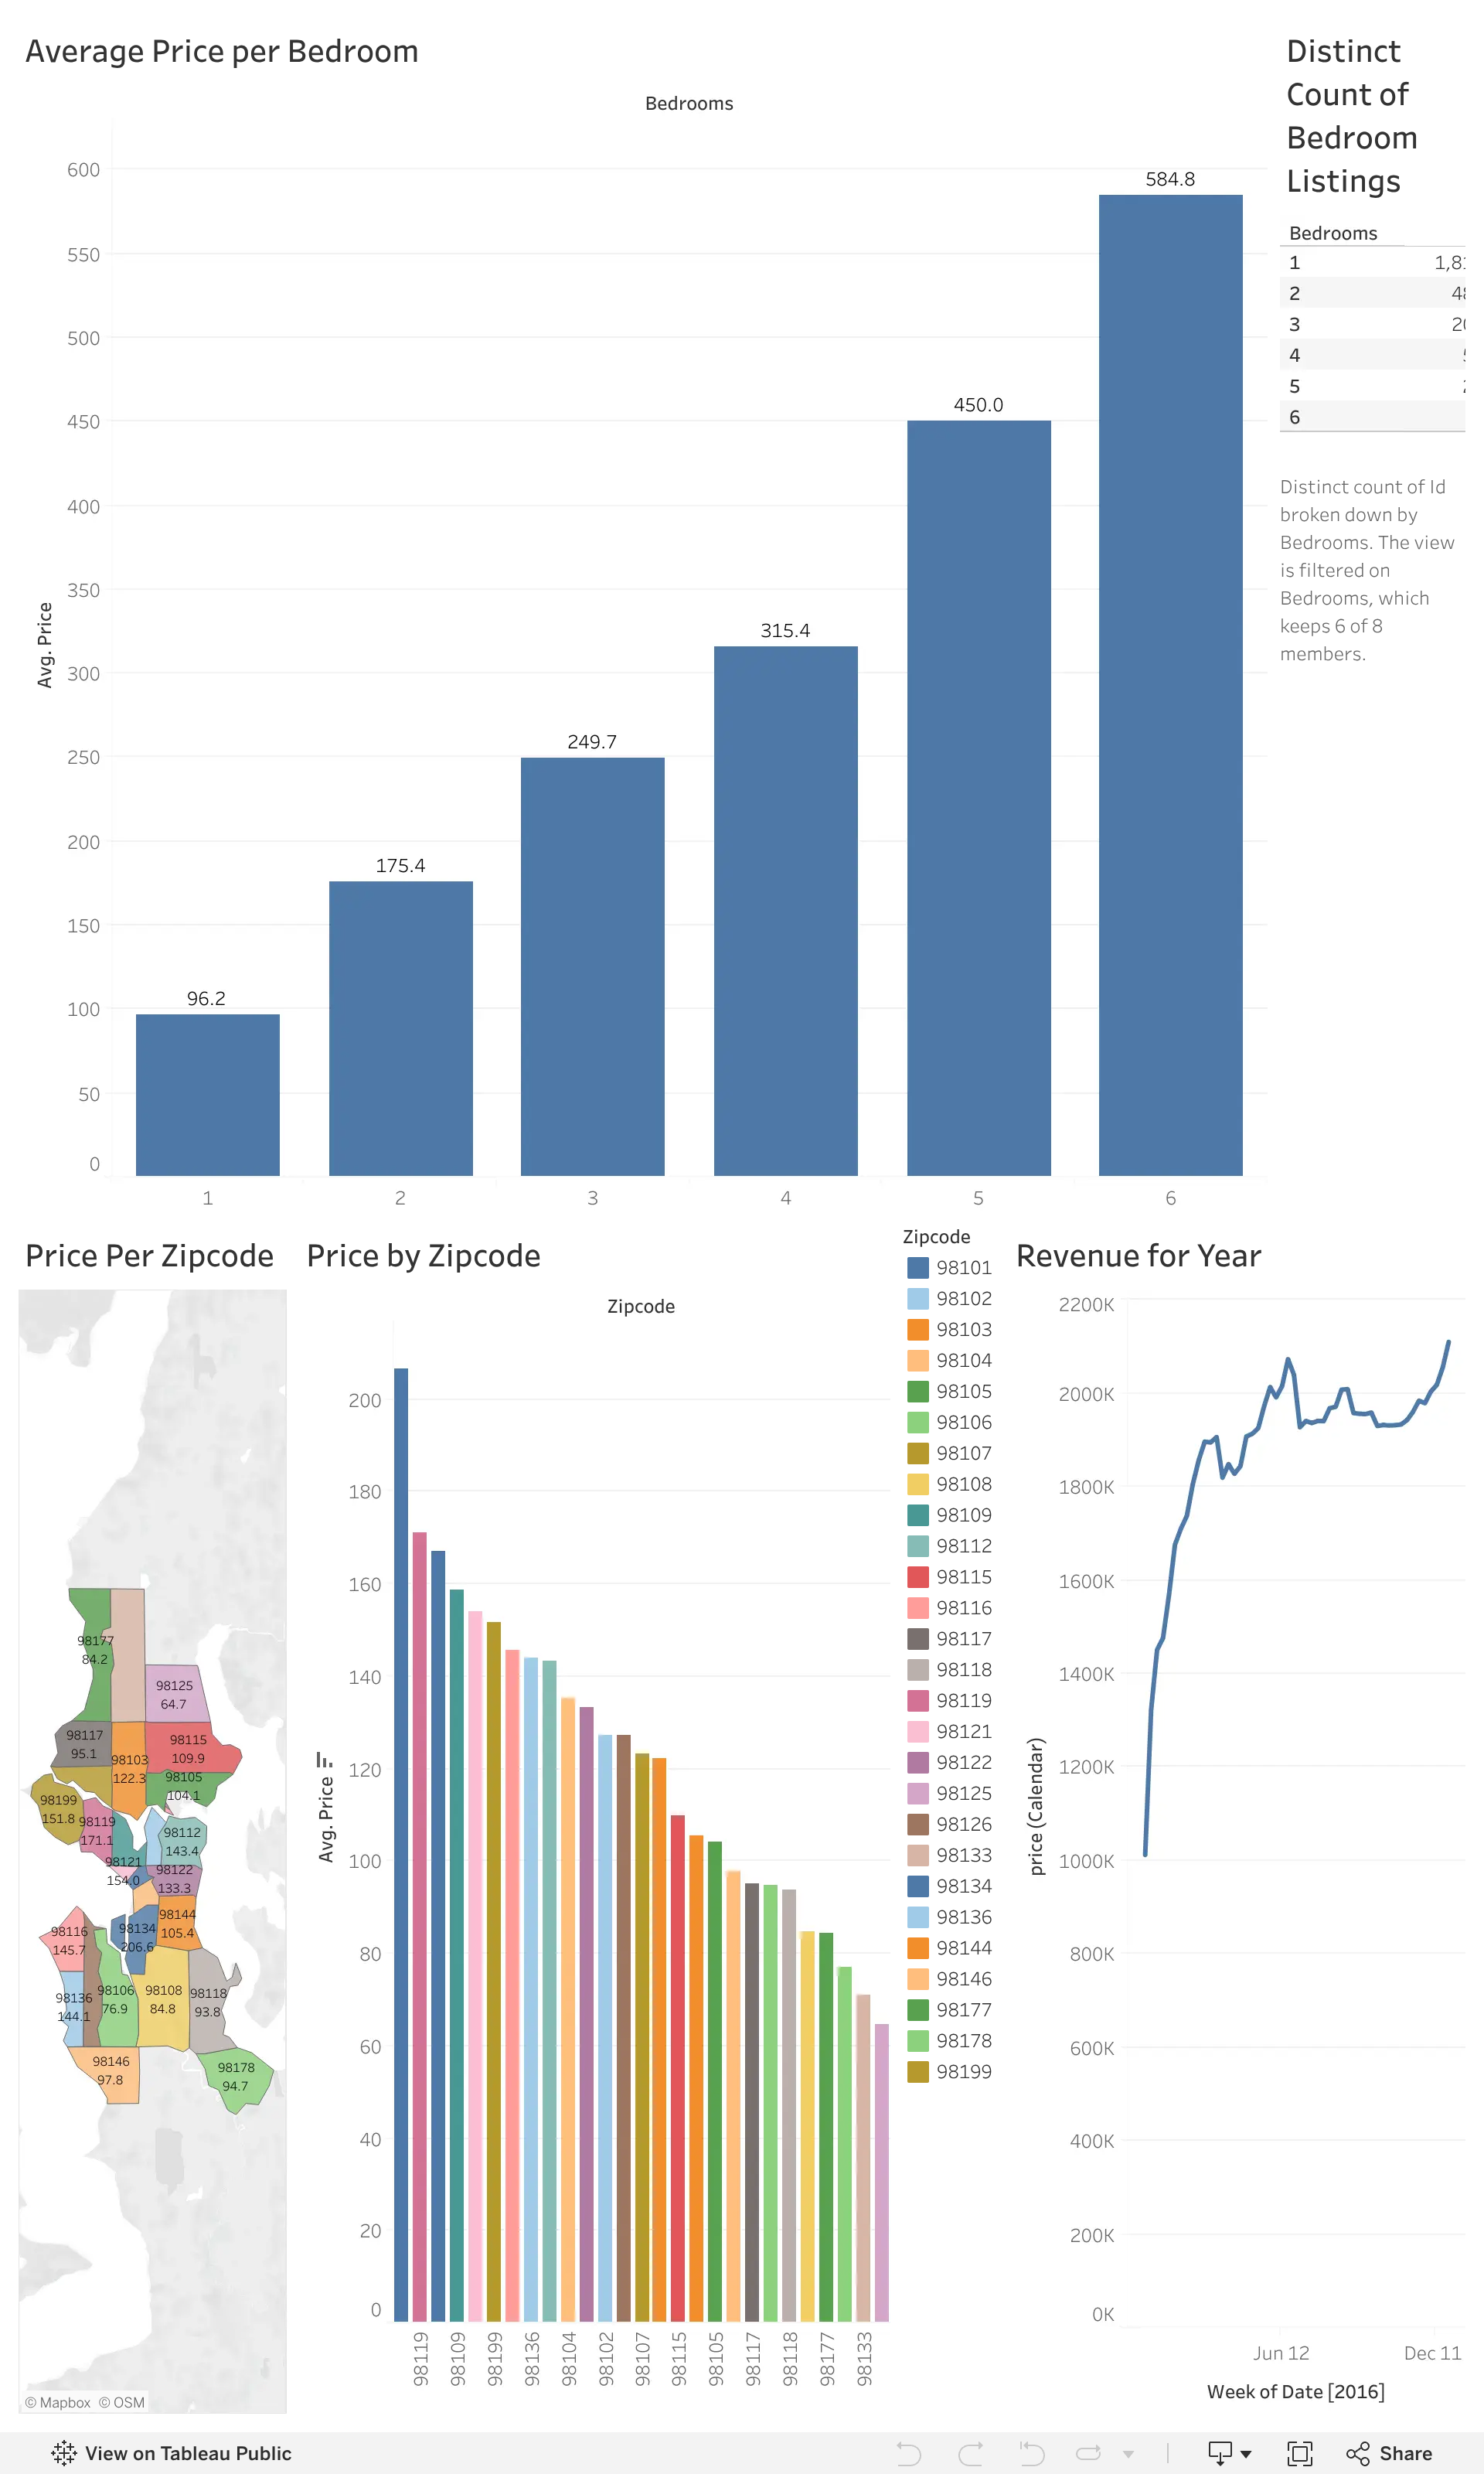
Since we know how to utilize joins in Tableau, let's apply it to a dataset and make a dashboard. The dataset is Airbnb listings in the Seattle area from 2016. Making a dashboard on the dataset can be useful if you want to gain insight on what kind of listings generate revenue. You can determine how to maximize revenue depending on the zip code, month, and the number of bedrooms your listing may offer. The best time to rent out your listing is during the summer months and holiday season in December. The average price for a 6 bedroom listing is $584.80. The highest average price for the 98314 zip code is $206.60. Take a look at the dashboard I created for this dataset.